Figure 1. Citizen priorities for coastal managers, ranked by urgency (1=Should not be done, 7=Top priority); respondents were allowed to select more than one action as "top priority". Percentage values <5 not displayed.
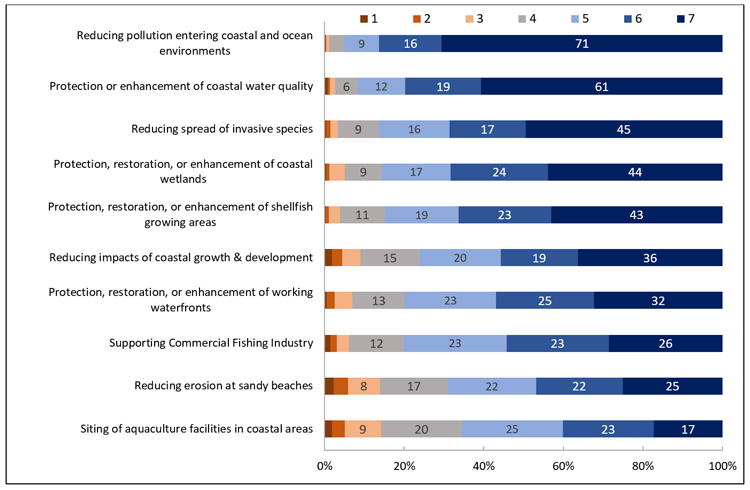
Figure 2. Resident perceptions about factors negatively impacting water quality (1=No negative impact, 4=Somewhat negative, 7=Very negative); respondents were allowed to choose "very negative" for more than one factor. Percentage values <5 not displayed.
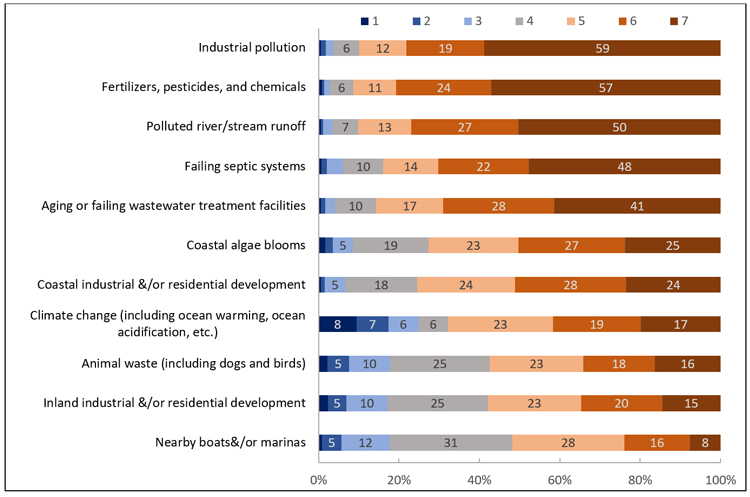
Figure 3. Respondent ratings of hypothetical Coastal Water Quality Program outcomes (1=not at all important, 4=somewhat important, 7=very important); respondents were allowed to pick more than one outcome as "very important". Percentage values <5 not displayed.
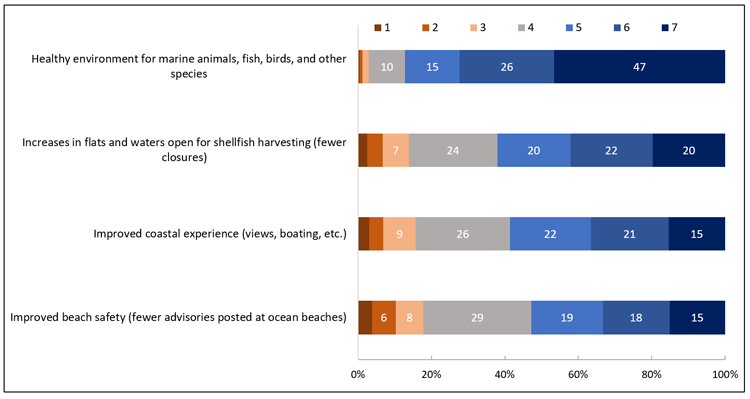
Figure 4. Percentage respondents New England states and Canadian provinces for their coastal water quality; data labels provided for select ratings. Percentage values <5 not displayed.
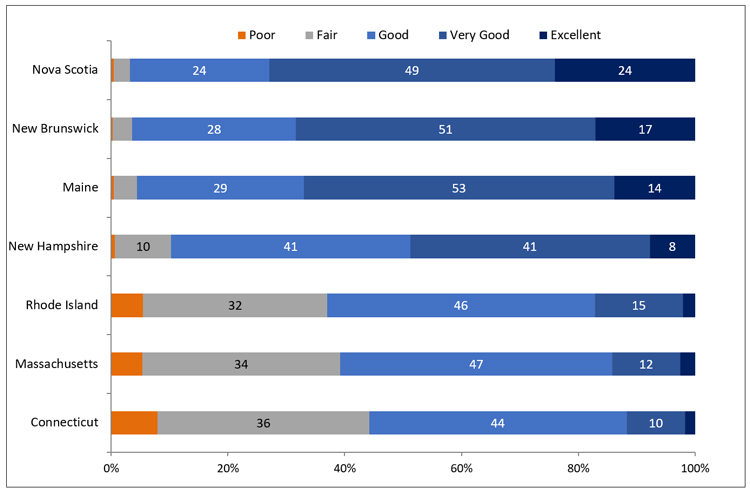
Figure 5. Percentage of respondents agreeing to statements about responsibility for water quality; respondents rated categories on a Likert scale from 1 (strongly disagree) to 7 (strongly agree). Percentage values <5 not displayed.
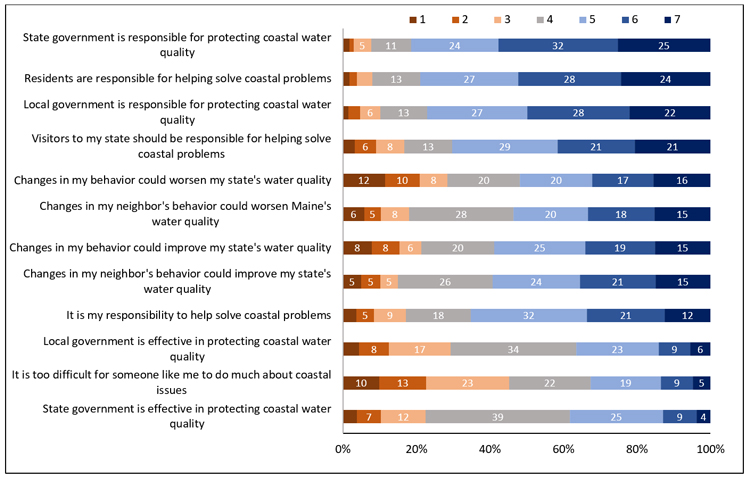
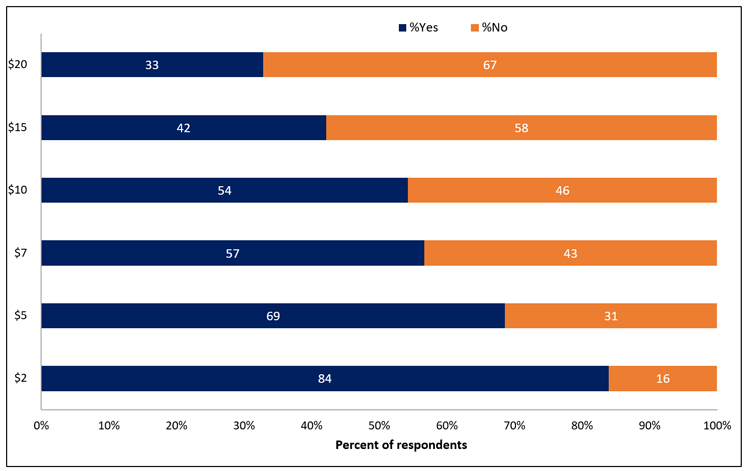
Figure 6. Willingness to contribute to a coastal water quality program by fee amount; percentages represent the percentage of citizens responding yes or no to support at each dollar amount. Percentage values <5 not displayed.